Greetings,
The current state of the market is confusing, if you do not understand patterns and what is actually happening. It is a positive year so far for the S&P 500, and it is not rational to think the S&P 500 can go up all year with no pullbacks. Some people use fundamentals to navigate the pullbacks, some use technical analysis, and some use both. It is best to be proficient in both, but more knowledgeable of the technical side. If all else fails, just wait until the end of November and see what the market is preparing for.
So where is the market going? Historically, September - December the market is shifty usually to the down side, so that is one thing to consider. Unless there are some rate cuts, new products/technologies, or the war talk dies down, there is nothing to make the market pop. So that leads us to technical analysis.
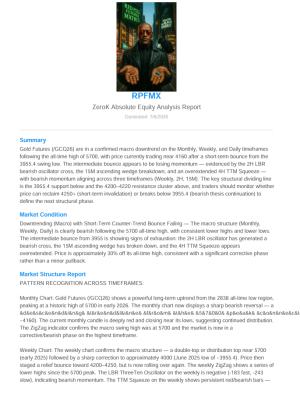
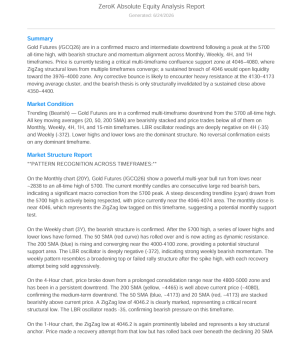
The attached pictures are of the ES futures and display the daily charts for 9-4-2025 and 9-4-2026. If you use the correct indicators, patterns can easily be identified. If you have the book then you know the patterns displayed in the pictures. Let's examine 9-4-2025 and see what the chart from the past can tell us. On 9-4-2025 the price bounced off of the lowest moving average and was above all of the moving averages, in addition to the bar being green. The same bar on all of the lower indicators showed positive action building to the upside. If we look further up the chart we will see the price continued to increase until about October, as long as the price closed above all moving averages. As soon as the price closed below the first moving average, the market took a dip and so did the lower indicators. The current rule going forward should be based on the price closing above all of the moving averages, the bar closing green if the open is not above all moving averages, and all the lower indicators closing above their zero lines. Once there is an open below the first moving average, look for a bearish trend.
Now jump to the 9-4-2026 chart and you will see the price closed above all moving averages and all of the lowers are positive or trending toward positive bars. This year the pattern may continue the same as last year if the price continues to close above all moving averages. However, there are a few differences that tell me to be cautious. Can you spot them? The first difference is in the first lower indicator, the yellow line, also known as the slow line, was above the zero line last year, buy below it this year. We need the slow line to crosse above the zero line for confirmation of a bullish trend. If the slow line curves down with a red bar or an open below the first moving average, then the price action will likely be bearish. At this point it is a waiting game.
Another difference is the recent high on the 9-4-2026 chart. The recent high was made around the beginning of August so the current price is falling from a high, which would explain why the slow line is below the zero line this year. Last year, the 9-4-2025 chart showed a dip and a bounce off of the second moving average which sent the market into a bullish trend, that also explained why the slow line was above the zero line. We are coming off of a bounce but the recent high of 7838.5 is where the strongest resistance is. That high is the variable that must play out over the next few days.
So how do you take advantage of the current market conditions? Both sides of the market can be played. Buying a December PUT when the market opens with the expectation that the market will be lower than the second moving average at some point over the next 3 months, is one way to make some money. You can also watch for the drop below the second moving average and look to buy a CALL when signs of a bullish recovery in the lower indicators appear. However, you can never know how low a market pullback will go, so you must wait for confirmation. With that said, if a PUT is purchased at the next market open, if at any time the price holds above 7800 for more than a day or two, the PUT should be closed to minimize losses.
Only time will tell what will happen next, but it is always important to follow the charts. Occasionally, sitting back and watching is the best thing to do. If you have that itch where you just need to be active, you can always invest in T-Bills, FYEE, SCHD, DIVO, QQQI, FTEC, or FDVV. Until next time, invest wisely and Temet Nosce.
~MorpheusCCI~
RPB - CIC