Investing The OVBE Way/digital-wall-st/1093/march-ovbe-wealth-building-newsletter/public/sitereview_listing/14/3e/02/62d01b7f2d22277327e0d385a6ede6e6.jpg
Investing The OVBE Way/digital-wall-st/1122/april-ovbe-wealth-building-newsletter/public/sitereview_listing/1e/43/02/5089f18dbdcf78c98d01088bad86bc65.jpg
Investing The OVBE Way/digital-wall-st/1136/may-20-ovbe-wealth-building-newsletter/public/sitereview_listing/a6/44/02/47b16d5b94afee80e33192a8456c2bbd.jpg
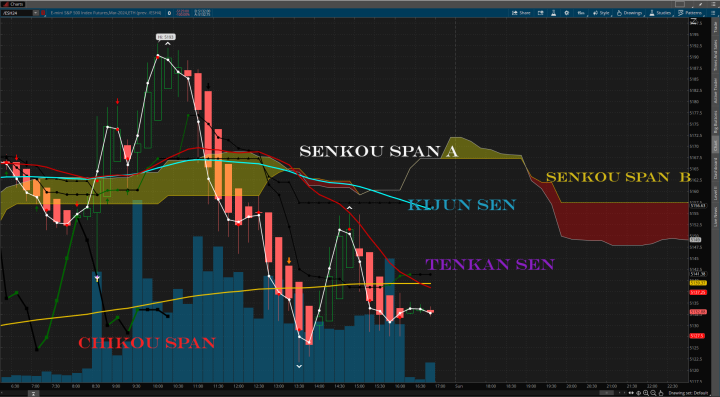
What you see is the Ichimoku Cloud with a Zero K twist. The purpose of the Ichimoku Cloud indicator is to provide the investor with the most critical information in one glance. You should be able to view any stock or commodity and quickly know the current trend, supports and resistances, potential future trend, strength of the trend, and where the reversal point will occur. However, that is only if you are aware of what you are looking at.
It would take an hour or two, to verbally explain what each indicator does and how they are interwind. For the purpose of this article, I will give short descriptions and explain only the most important aspects of the components affected by the application of the Zero K Absolute concepts. There are five components in the Ichimoku Cloud indicator that are easy to spot, and they all provide insight into the direction of a stock or commodity as one unit. They are as follows:
Tenkan Sen (Conversion Line: (High + Low)/ 2 default period =9) circle dotted line Kijun Sen (Base Line: (High + Low) / 2 default period = 26) triangle dotted line Senkou Span A (Leading Span A: (Tenkan Sen + Kijun Sen) / 2 (Senkou A is shifted forward 26 bars) white line atop of the gold cloud, bottom of the red cloud Senkou Span B (Leading Span B: (High + Low) / 2 using period = 52 (Senkou B is shifted forward 26 bars) gold line atop of the red cloud, bottom of the gold cloud Chikou Span (Lagging Span: Price Close shifted back 26 bars) square dotted line
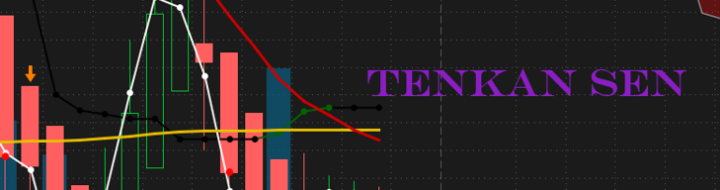
In my opinion the most important component is the Tenkan Sen, which functions like an ATR trailing stop or the Super Trend indicator. When the Tenkan Sen is below the price open or below the candles, then price action will be bullish. If the Tenkan Sen is above the price open of above the candles, the the price action will be bearish. One look at the chart, and you can quickly identify the short term trend and price action based on the position of the Tenkan Sen.
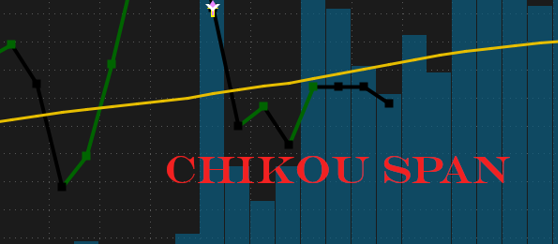
The second most important component is the Chikou Span. The Chikou Span will immediately show if the overall trend is bullish or bearish. If the Chikou Span is above the price close or above the candles, then the overall trend is bullish. If the Chikou Span is below the price close or below the candles, then the overall trend is bearish. The larger the distance of space between the Chikou Span and the candles, the stronger the trend. The direction of the Chikou Span is very straight forward, and whichever way it points is where the price will go or headed toward. Trend reversals occur when the Chikou Span is about to collide with the candles and cross above or below, that usually happens when the Chikou Span starts moving horizontally as volume dissipates.
The next three components are more suggestive and nature and are not the main characters of the movie, but have supportive roles that enhance the backdrop. The Kijun Sen moves exactly like the Tenken Sen with regard to price action and the candles, but it stays further way and acts as a reversal precursor. Before a trend reversal is in full effect, the Tenkan Sen has to cross above the Kijun Sen for a bull reversal, or cross below the Kijun Sen for a bear reversal. The larger the distance between the Tenkan Sen and the Kijun Sen, the longer it will take before a trend reversal occurs. The Kijun Sen gives a good heads up and should be used as confirmation of the trend reversal continuing, because if the Tenkan Sen does not cross above the Kijun Sen for a significant distance, then the reversal will fade as volume dissipates.
Next we examine the the Senkou A and B clouds. The Senkou A cloud is bullish, and during a bull trend the candles will be above the cloud. The cloud will be gold or whatever color you choose and the actual Senkou A, depicted as a white cloud border in the picture, will outline the top portion of the cloud. The Senkou B cloud is bearish, and during a bear trend the candles will be below the cloud. The cloud will be red or whatever color you chose and the actual Senkou B, depicted as a gold cloud border in the picture, will outline the top portion of the cloud. The Senkou A and B lines are leading 26 periods ahead, and their crossings represent potential trend reversals. If the Senkou A crosses above the Senkou B, look out for a bullish reversal, and if the Senkou A crosses below the Senkou B, lookout for a bearish reversal. The crosses do not indicate definite reversals, so take them as suggestions. Also, the taller the cloud, the stronger the trend. There is so much more I can expand on, but now is not the time. In the near future, I will add the Ichimoku Cloud Basics course to the OVBE Academy so we all can get on the same page. You have been exposed to the basics, now let's get to the Zero K twist.
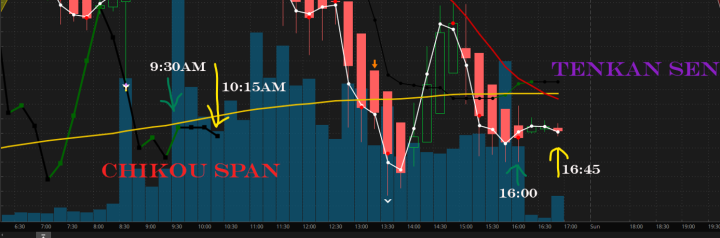
The Zero K Absolute concepts were added to the Ichimoku components to enhance the ability to predict the direction of the price and trend. In the picture, when a line turns black, notice bearish price action, when a line turns green notice bullish price action.
To understand what you are looking at without seeing it in motion, let's examine the the Chikou and the red candle furthest to the right. As stated above, the Chikou is 26 periods behind the current price close, so each square on the Chikou represents a candle 26 periods ahead of it. The picture is of a 15 minute chart and the last square on the Chikou is at 10:15 am, here comes the math. You count 26 candles from the last Chikou square, or you can multiple 26 x 15, which equals 390, then divide that by 60 minutes, and you get 6.5 which represents 6 hours and 30 minutes. 6 hours and 30 minutes from 10:15 am is 1645 hrs. Yes, once you learn to think in military time, you never forget it, and I finally found the proper use for it.
The very last four squares of the Chikou Span consist of one green square and three black squares, stay with me. The green square on the Chikou Span hovers over the 9:30 am mark, which represents the 1600 hrs candle 26 periods ahead. When you look at the 1600 hrs candle, you notice that the price is going up attempting to be bullish, but turns bearish. The last three candles of the Chikou Span are black, which is a signal to expect bearish price action. So in real time, if you were examining the Chikou Span for signals, around 9:45 am you would have expected bearish price action, even though the candle 26 periods ahead was green. Going in a little deeper, at the same time the Tenkan Sen above the candles, turned from green to black between 16:15 and 16:30 to align with bearish price action of the Chikou Span. That my friend, is what I call Zero K Absolute confluence. Beyond what I just pointed out, you also notice that the leading cloud is red and the Chikou Span is no where close to crossing above the candles for a bull trend reversal and pointing down, which means more bearish price action is likely. If the daily session was not about to end, it would have been a good time to enter a short trade.
Considering what I have stated, you should be able to see how the Zero K Absolute concepts enhanced the signals already provided by the Ichimoku Clouds in it's stock format. This adaptation is also just another one of my many creations, that assist with brining to life the things that my brain overlays on the charts when I study them. Over the next couple of years I will slowly introduce my creations to OVBE members, which may eventually end up in the hands of the masses. I also plan to release books with documentation of the indicators I create, in effort to contribute something meaningful to the investing community. Until that time comes, stay tuned to OVBE and the Red Pill Futures Matrix YouTube channel for updates.