Investing The OVBE Way/digital-wall-st/1093/march-ovbe-wealth-building-newsletter/public/sitereview_listing/14/3e/02/62d01b7f2d22277327e0d385a6ede6e6.jpg
Investing The OVBE Way/digital-wall-st/1122/april-ovbe-wealth-building-newsletter/public/sitereview_listing/1e/43/02/5089f18dbdcf78c98d01088bad86bc65.jpg
Investing The OVBE Way/digital-wall-st/1136/may-20-ovbe-wealth-building-newsletter/public/sitereview_listing/a6/44/02/47b16d5b94afee80e33192a8456c2bbd.jpg
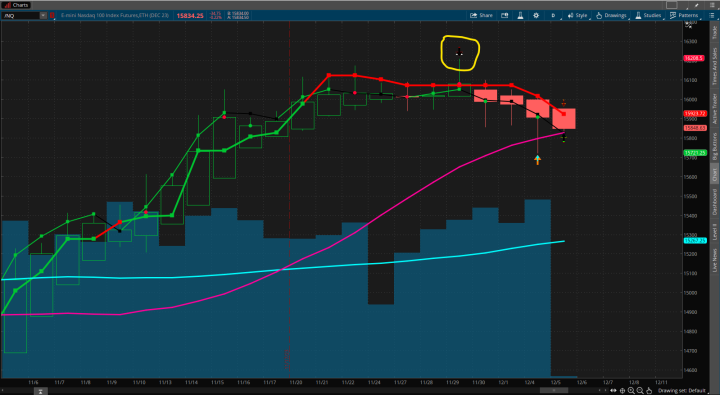
December 4, 2023 a QSC circled in yellow above, appeared on the NQ daily chart which signified an overall bear trend is about to start. In this situation price action will be bearish until a QDC appears in the opposite direction. That could take days, weeks, or months, but it usually only takes a few days.
In the mean time the price will go up, but never higher than the QSC until a QDC is confirmed within two bars. When this happens, I like to buy NQ, NDX, and XND PUT options, which will not be sold until I reach my profit target, or until the first sight of a QDC followed by at least two green bars.
As the price fluctuates, I will look to add to my position at the peak of the price action. We already know the ball is rolling down hill, the goal is to go with the trend and stay out of the way. Of course the trend is not definite and we could a see a QDC tomorrow, but at the current moment the trend is bearish. So I will set my QDC alert and wait for the magic to happen, but still be prepared to take action if the trend turns bullish.