Investing The OVBE Way/digital-wall-st/1093/march-ovbe-wealth-building-newsletter/public/sitereview_listing/14/3e/02/62d01b7f2d22277327e0d385a6ede6e6.jpg
Investing The OVBE Way/digital-wall-st/1122/april-ovbe-wealth-building-newsletter/public/sitereview_listing/1e/43/02/5089f18dbdcf78c98d01088bad86bc65.jpg
Investing The OVBE Way/digital-wall-st/1136/may-20-ovbe-wealth-building-newsletter/public/sitereview_listing/a6/44/02/47b16d5b94afee80e33192a8456c2bbd.jpg
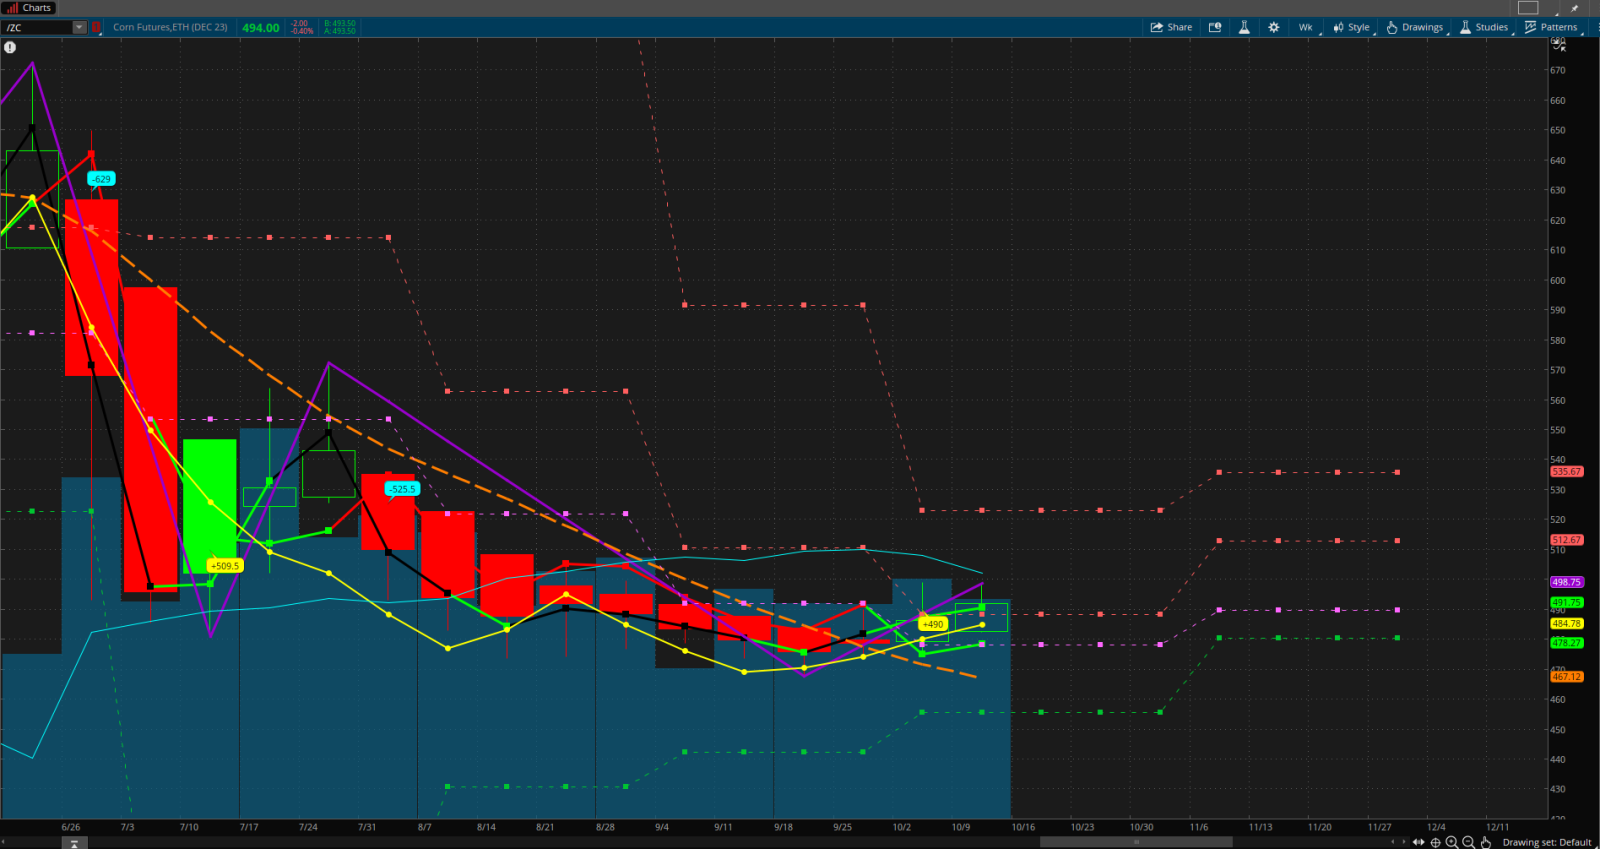
The chart displayed below is the weekly for October corn futures (ZC). As you can see, at the end of the week of October 13, 2023 the candle finished bullish with no wick at the bottom. The chart also shows that the bull reversal started a week prior, signified by the green X. So in my opinion, based on the indicators the probability is high that the candle for the upcoming week starting October 15 will open green/bullish. So what should an astute futures trader do?
Stay on the sidelines if you have no idea of where the price is going and what it may do once it reaches it's destination. Wait until you see confirmation of the trend you think is forming. In situations like this where I think the the current trend is bullish. My go to plan is to buy At The Money (ATM) CALL options and look to exit at signs of weakness. Always remember that things can reverse quickly, so be prepared to identify reversals, and aware that trends do not last forever. The mission is always to catch the beginning of a trend, exit with what you think is an acceptable gain, and regroup for the next battle.
The ZC and XC futures are in my sights this week. My strategy involves buying CALL options and entering long contracts when I identify bull reversals. You should be aware that not all futures trade the same hours. Corn futures trade from about 8:00pm to 2:20pm EST. Sunday through Friday.
As you should already know, I love the ability to enter and exit futures as many times as I like without having to worry about the pattern day trader rule. The hardest a part of trading futures is know when to get in and not trying to shoot for the moon when it comes to profit. The market giveth and the market taketh, especially due to the volatility of the futures market.
There are six days in a trading week, so that means to stay ahead of the bear reversal you need to monitor the days on the daily chart for early exit signals. The decrease or increase in momentum will dictate how long I stay in this trade. As I stated above, this weekly candle has no bottom wick, so if the next weekly candle does not develop a bottom wick, we can probably ride the wave into the fourth week. Big moves up and down can happen in a week, so being patient is critical. I trust my indicators and you must learn to trust yours.
I hope my analysis helps you see something you did not see, or confirmed what you already saw. As always do your own research and manage your risk.